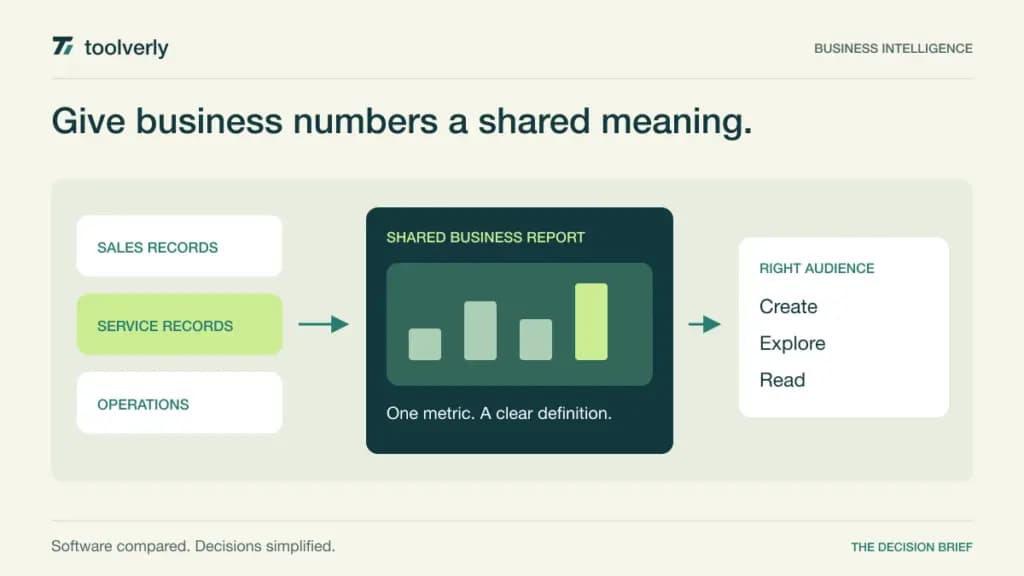
A dashboard becomes useful when its readers agree on what the numbers mean and can act on them. The difficult part of buying business intelligence software is often deciding who prepares the data, who may change a calculation, and who only needs to read the report. Those roles can also determine the license bill.
We compared Microsoft Power BI, Tableau, Google Data Studio, Metabase, and Zoho Analytics using official material checked on September 30, 2026. This is an editorial comparison of capabilities, access models, and current pricing, not a hands-on performance test. Currency and billing periods are stated explicitly; displayed regional prices and tax treatment can differ.
These products address reporting across business data sources. If you only need to understand visits and conversions on a website, our website analytics guide covers that narrower decision. A BI platform is most useful when you need to connect those observations with operational, sales, or other business records.
Five approaches to shared reporting
| Product | Useful starting point | Verified price example | Main purchasing question |
|---|---|---|---|
| Microsoft Power BI | Microsoft-centered report distribution | Pro: $14/user/month, paid yearly | Which viewers need licenses or qualifying capacity? |
| Tableau | Distinct author, explorer, and viewer roles | Cloud Standard Creator: $75/user/month, billed annually | How many people need each role? |
| Google Data Studio | Accessible shared dashboards | Free version; Pro lists $9/user/project/month | Who owns content and administration? |
| Metabase | Business questions over connected data | Cloud Starter: $100/month including five users | When do permissions require Pro? |
| Zoho Analytics | Bundled users and data capacity | Standard: €48/month, billed annually | Do user and row limits fit growth? |
Use this table to build a shortlist, not to identify a universal lowest price. A five-person analyst group publishing to two hundred readers has a different cost structure from a small team in which everyone builds reports. Include both populations in the quote.
Microsoft Power BI
Power BI Pro is listed at $14 per user monthly, paid yearly. Premium Per User is $24 on the same basis. Pro is also included in Microsoft 365 E5 and Office 365 E5. Microsoft distinguishes free report creation from licensed sharing and distribution, so the presence of Power BI Desktop does not mean every viewer can consume every shared report without additional licensing.
Strength: an organization already purchasing the relevant Microsoft licenses can evaluate BI access alongside its existing user administration. Pro, Premium Per User, and capacity options provide different purchasing paths.
Limitation: capacity does not automatically eliminate every per-user requirement. Microsoft’s pricing notes specify qualifying P1 or F64-and-above capacity for consumption without a paid per-user license, while publishing requirements still matter. Best fit: a Microsoft-centered organization prepared to map creators, contributors, and readers carefully. Before committing, have the vendor explain access for one ordinary employee and one external recipient using your actual license combination. Review Microsoft’s Power BI pricing and footnotes.
Tableau
Tableau Cloud Standard separates Creator, Explorer, and Viewer licenses. Their listed prices are $75, $42, and $15 per user monthly respectively, billed annually. Each deployment requires at least one Creator. Creator includes Tableau Desktop and Prep Builder for authoring and preparation; Explorer supports exploration and editing of existing content, while Viewer focuses on consuming and interacting with published work.
Strength: these explicit roles support a deliberate division between a central analytics team and the broader audience. A department can examine whether its occasional report editors truly require the same license as the people building data flows.
Limitation: three roles mean the headline Creator price is only one component of the total. Enterprise editions have different prices, and Cloud should not be confused with a self-managed Server deployment. Best fit: organizations that want an established authoring workflow and can govern report ownership. For evaluation, ask a creator, an occasional editor, and a reader to complete different tasks with the proposed permissions. Confirm the annual commitment and role counts against Tableau Cloud’s current pricing.
Google Data Studio
Google’s current official page uses the name Data Studio. It describes a no-cost version for creators and viewers, plus Pro at $9 per user, per project, per month; subscription duration can affect pricing. The product includes a drag-and-drop report editor, sharing and embedding, and connections to services such as Sheets, Google Ads, BigQuery, and Google Analytics. Pro adds team content management, administrative capabilities, and Cloud support.
Strength: it is a natural candidate when the first reporting need is a shared dashboard assembled from familiar Google data sources. The free version provides a concrete way to evaluate whether the report itself helps its intended audience.
Limitation: a free reporting interface does not settle ownership, support, or the cost of every underlying data source. Confirm any connector or data-processing charges in your design. Best fit: teams seeking accessible reporting with a manageable starting scope. Before expanding, decide whether personal ownership is acceptable or team-managed content is necessary. Keep this product distinct from other Google Looker offerings when requesting a quote. See Google’s Data Studio overview and pricing.
Metabase
Metabase offers both a visual question builder and SQL-based exploration. Its monthly Cloud Starter plan is $100 including five users, with additional users at $6 monthly. Cloud Pro is $575 including ten users, with additional users at $12. Pro includes features such as row and column permissions, SSO, and usage auditing. Annual billing is advertised with a 10% saving.
Strength: the question-oriented workflow is worth evaluating when business colleagues need answers from shared data without every request becoming a custom analyst project. Technical staff can still work directly with SQL where appropriate.
Limitation: access requirements may move the organization into Pro before the user count alone would suggest an upgrade. Some AI, transformation, and storage usage has separate allowances or charges. Best fit: teams with a maintained data source and an owner who can explain its tables and definitions. Test whether a business user can answer a recurring question and understand its filters without assistance. A database client remains a separate tool for database work. Check Metabase’s deployment and plan options.
Zoho Analytics
The reviewed European pricing lists Zoho Analytics Standard at €48 monthly, billed annually, with five users and one million rows. Basic is €24 with two users and 500,000 rows. Plans allow unlimited reports and dashboards, but the user and data allowances remain separate constraints. Extra users, viewers, and rows can add cost, and local taxes are excluded from the displayed prices.
Strength: bundled capacity makes it possible to start the discussion with a concrete team size and data volume. A small organization can compare the package against the records it expects to load, rather than only counting dashboard pages.
Limitation: unlimited dashboards do not mean unlimited data or unrestricted access for every employee. The pricing page describes viewer add-ons with a minimum quantity, which matters when only a few additional people need read access. Best fit: a business that can estimate its data growth and prefers a defined package. Include historical records and recurring imports in the estimate, not just this month’s transactions. Use Zoho Analytics’ regional pricing for the final user, viewer, and row configuration.
Evaluate one decision before building twenty dashboards
Choose a recurring business meeting and write down the decision it should support. For example, a service team may need to identify work waiting too long for assignment. Define the start and end timestamps, the relevant population, and who owns exceptions. A polished chart cannot resolve an ambiguous definition of waiting time.
Build a small acceptance dataset containing ordinary records, missing values, corrections, and a deliberately unusual case. Ask the analyst to explain how each affects the metric. Then ask an intended reader to identify the next action from the report. This tests usefulness without pretending that a product demo measures future business performance.
Evaluate permissions with similarly concrete examples. Can a regional manager see another region’s records? Can someone download the underlying data? What happens to a report when its original author leaves? Require a demonstrated answer for the selected plan, because an enterprise feature shown in a demo may not belong to the proposed subscription.
Finally, compare the annual cost of authors, occasional editors, readers, data capacity, connectors, support, and maintenance. Assign an owner for each published metric and a review date for unused reports. The right BI platform is the one your organization can keep understandable and trustworthy as the audience grows.
Original illustration by Toolverly. Read about our publication or send a correction.