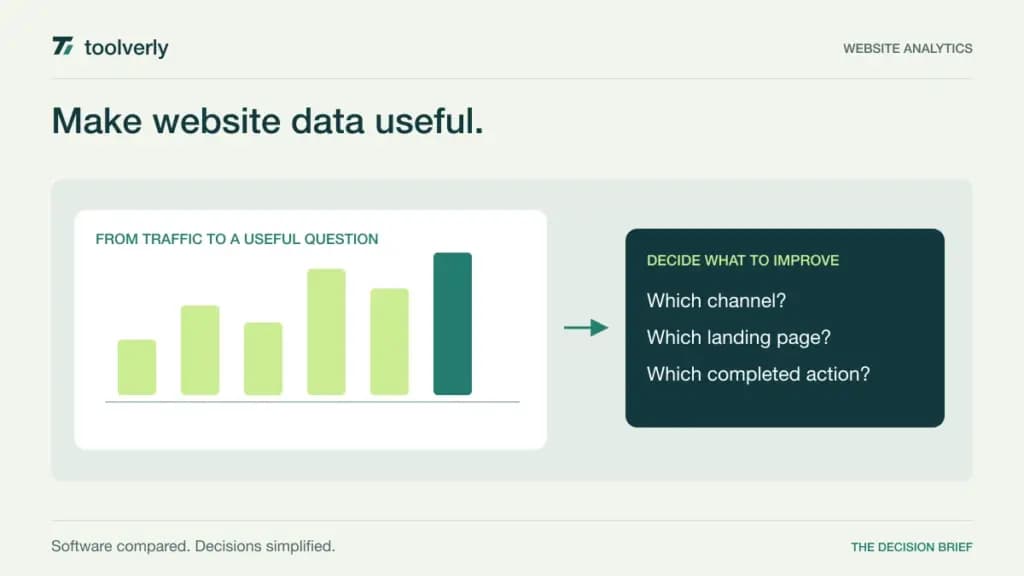
A traffic dashboard is useful only when it changes a decision. A marketing team might need to identify which campaigns produce inquiries, while a publisher wants to understand which pages bring readers back. Neither automatically needs a complicated collection of reports. The right website analytics service should make those recurring questions easy to answer and make its measurement limits understandable.
This comparison covers Plausible, Fathom, Matomo, Simple Analytics, and Umami. They offer different combinations of accessible reporting, event analysis, hosting choices, and commercial limits. The focus is measuring visits and actions on a business website. For availability and incident alerts, see our separate comparison of website uptime monitoring software.
Toolverly reviewed official product and pricing pages on September 26, 2026. This is a documentation-based buying guide, not a hands-on accuracy benchmark. Prices below retain the currency displayed by each vendor, with billing and usage assumptions stated explicitly. A vendor’s privacy positioning does not establish what every other script on your website collects.
Start with the questions your team asks every week
Write down three decisions before comparing dashboards: which acquisition channels deserve attention, which landing pages need work, and which completed actions count as success. Define those actions precisely. An event named “lead” is ambiguous if it can mean either opening a form or successfully submitting it. Link campaign naming to your email marketing platform so traffic labels remain consistent from message to website.
Then estimate the billable volume. Pageviews, events, properties, and hits are different units. A visitor who views three pages and completes several tracked actions can generate considerably more than three billable records. Also check retention, reporting access for colleagues, and the process for exporting history. These details are easier to compare than a promise of a simpler dashboard.
| Product | Best fit | Main strength | Important tradeoff |
|---|---|---|---|
| Plausible | Teams wanting a compact traffic and goals dashboard | Clear reports with optional deeper analysis | Collaboration and funnels depend on the tier |
| Fathom | Small teams managing several websites | Shared traffic allowance and consistent features | Custom events consume the allowance too |
| Matomo | Organizations needing broader analysis and hosting choice | Detailed reporting and cloud or on-premise options | More configuration and a different usage unit |
| Simple Analytics | Teams prioritizing straightforward traffic reporting | Accessible dashboard and a GA4 comparison service | Additional users affect self-serve cost |
| Umami | Product-minded teams measuring website events | Events and reports with a managed or self-hosted route | Stored event properties increase cloud usage |
Plausible
Plausible is a strong candidate when the team wants traffic sources, pages, and goals in a compact reporting environment. Its official site describes campaign tracking, a Search Console connection, custom events, and automatic scroll-depth measurement. The useful distinction is between seeing where visitors arrive and analyzing a more detailed journey after arrival.
At the checked 10,000-monthly-pageview setting, Starter displayed €9 per month on monthly billing, with one website and three years of retention. Growth displayed €14, adding up to three sites and three team members. Business displayed €19 and listed funnels, user journeys, custom properties, and revenue attribution. Larger traffic selections cost more; these are entry-volume examples, not unlimited-traffic prices. See Plausible’s official features and pricing.
The strength is a manageable starting scope. A content team can agree on a few goals without maintaining a large reporting project. The limitation is that a low-cost single-site plan is not equivalent to the collaborative or deeper-analysis tiers. During evaluation, ask a colleague to answer a real campaign question and explain the result. If the explanation requires data unavailable on the intended plan, price the upgrade before approving the purchase.
Fathom
Fathom suits teams that want the same analytics feature set across a portfolio of websites. The pricing page organizes subscriptions around a shared traffic allowance rather than a long feature ladder. It includes email reports, CSV exports, and analytics history while the subscription remains active. This can make budgeting easier for an agency with several modest client sites.
The entry plan is US$15 per month for up to 100,000 monthly pageviews, with 50 sites included. Crucially, custom events also count toward that allowance across all sites. Annual billing offers two months free. The seven-day trial requires a card and begins paid billing automatically unless cancelled. Those terms are documented on Fathom’s pricing page.
The main advantage is predictable feature access as traffic grows. The limitation is the shared pool: one busy property or a newly added set of events can change the economics for the whole account. Model both a typical month and a campaign spike. For client work, also verify who can see each site’s reporting and who owns the export when a contract ends. Website count alone is a poor proxy for the amount of analytics you will consume.
Matomo
Matomo deserves attention when a simple traffic overview is only the beginning. Its platform includes goals, segmentation, campaign and ecommerce reporting, with managed cloud and on-premise deployment choices. This wider scope is useful when different departments need different views of the same website rather than one shared headline report.
The checked Cloud Business configuration displayed €22 per month, excluding tax, for 50,000 monthly hits on monthly billing. It listed 30 websites, 30 team members, 24 months of raw-data retention, and ongoing report retention. Annual billing offers two months free. Additional hits are charged separately. The on-premise core offers a free software route, but infrastructure, maintenance, and any paid extensions still need a budget. Consult Matomo’s hosting and pricing comparison.
The benefit is room to support more detailed analysis. The tradeoff is ownership: someone must configure tracking, maintain consistent definitions, and decide which reporting capabilities are actually needed. A self-hosted installation also needs a responsible technical owner. Before choosing it for greater control, have that owner describe backups, updates, capacity, and access management. Control creates useful options only when the organization can operate them reliably.
Simple Analytics
Simple Analytics is worth considering when the reporting audience mainly wants a readable picture of website traffic. Its current offer separates self-serve analytics from an assisted enterprise evaluation alongside GA4. That distinction matters: buying a dashboard and buying help investigating differences in measurement are different scopes of work.
The monthly self-serve view displayed US$20 per month at 100,000 pageviews, including one user, with an additional US$20 per month for each extra user. The hobby plan lists one user, five websites, one month of history, and a required badge. Enterprise pricing is custom. The self-serve trial lasts 14 days, while the assisted proof of concept is described as 30 days. See Simple Analytics’ current plans.
The strength is an approachable reporting experience and a clearly described comparison process for organizations questioning their existing measurements. The limitation is that several colleagues needing access can materially change a small account’s price. A short-history hobby plan also will not support year-over-year analysis. For a trial, compare the same pages and dates across systems, then explain differences in implementation and metric definitions before treating either number as the correct business total.
Umami
Umami fits teams that want event-oriented website analysis with both a managed cloud option and an open-source self-hosting route. Its cloud plans expose reporting such as funnels, goals, journeys, and attribution. The important purchasing question is how much data those useful reports require you to collect and retain.
Cloud Hobby is free for one website, up to 100,000 events per month, and six months of retention. Pro is US$20 per month, including one million events, up to 20 websites, ten team members, and two years of retention. Additional Pro events cost US$0.00003 each. The usage definition includes pageviews, custom events, and each stored event property. Business adds capabilities including session replays and heatmaps. See Umami’s official cloud pricing.
The appeal is useful analysis with an explicit event budget. The limitation is that adding properties to every event can increase billed usage even when visitor traffic stays flat. Start with the smallest event schema that answers the business question. If considering self-hosting, compare its actual feature set and operating costs with Cloud rather than assuming identical service at zero total cost. Export and retention requirements should be part of that comparison from the start.
Choose a measurement routine you can maintain
Shortlist Plausible for a compact dashboard with clear upgrade paths, Fathom for several websites sharing consistent features, and Simple Analytics for a straightforward reporting audience. Put Matomo on the shortlist when broader analysis or hosting control matters. Consider Umami when the team wants event-based reporting and can manage the associated data volume carefully.
Run a small evaluation around one campaign, one landing page, and one completed conversion. Confirm that the success event fires once, that redirects preserve campaign labels, and that internal traffic is handled consistently. Have the eventual report reader interpret the output without assistance. This is a proposed evaluation checklist, not a claim that Toolverly performed those product tests.
Finally, name a report owner and a monthly review date. Record the reason for any tracking change beside the resulting chart. A dashboard becomes more trustworthy when the team can explain its definitions, its missing data, and the action it will take next.
Original illustration by Toolverly. Read about our publication or send a correction.